Data Visualization and Communication with Tableau
Formulate data questions, explore and visualize large datasets, and inform strategic decisions.In this Specialization, you'll learn to frame business challenges as data questions. You'll use powerful tools and methods such as Excel, Tableau, and MySQL to analyze data, create forecasts and models, design visualizations, and communicate your insights. In the final Capstone Project, you'll apply your skills to explore and justify improvements to a real-world business process.The Capstone Project focuses on optimizing revenues from residential property, and Airbnb, our Capstone's official Sponsor,
Created by: Daniel Egger
 Quality Score
Content Quality
/
Video Quality
/
Qualified Instructor
/
Course Pace
/
Course Depth & Coverage
/
Overall Score : 94 / 100
 Live Chat with CourseDuck's Co-Founder for Help
Need help deciding on a c course? Or looking for more detail on Daniel Egger's Data Visualization and Communication with Tableau? Feel free to chat below.
Join CourseDuck's Online Learning Discord Community
 Course Description
One of the skills that characterizes great business data analysts is the ability to communicate practical implications of quantitative analyses to any kind of audience member. Even the most sophisticated statistical analyses are not useful to a business if they do not lead to actionable advice, or if the answers to those business questions are not conveyed in a way that non-technical people can understand. In this course you will learn how to become a master at communicating business-relevant implications of data analyses. By the end, you will know how to structure your data analysis projects to ensure the fruits of your hard labor yield results for your stakeholders. You will also know how to streamline your analyses and highlight their implications efficiently using visualizations in Tableau, the most popular visualization program in the business world. Using other Tableau features, you will be able to make effective visualizations that harness the human brain's innate perceptual and cognitive tendencies to convey conclusions directly and clearly. Finally, you will be practiced in designing and persuasively presenting business "data stories" that use these visualizations, capitalizing on business-tested methods and design principles.
 Instructor Details

- 4.7 Rating
 111 Reviews
Daniel Egger
Daniel Egger has more than seventeen years experience creating new software products and services, as founder and CEO of a series of venture-backed information technology companies, and as Managing Partner in a venture capital fund. Egger is Executive in Residence in Duke University's Master of Engineering Management Program and has taught courses in entrepreneurship and venture capital at Duke since 2003. He was formerly the Howard Johnson Foundation Entrepreneur-in-Residence in Duke's Markets and Management Program for undergraduates.
 Reviews

- Video Duration:
 26h
26h - Price: Free 0 Track Price
- Provider:
 Coursera
 - University:
 Duke University
 - Language:
 English
 - Certificate:
 Yes
Yes
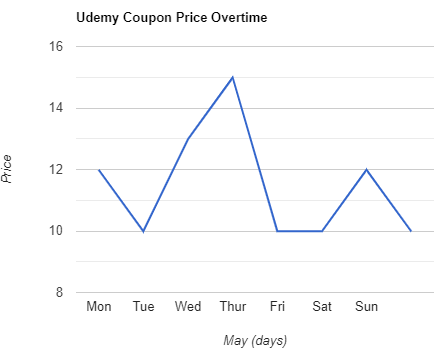
Coursera Coupon Price Tracker