Exploratory Data Analysis
Created by Johns Hopkins University, this Coursera course gets into the nuts and bolts of summarizing data. It covers varying techniques that help with modeling and statistical exploration. Its part of a program aimed at fostering expertise in data science.
Created by: Roger D. Peng
Produced in 2016
 Quality Score
Overall Score : 98 / 100
 Live Chat with CourseDuck's Co-Founder for Help
 Course Description
 redux Awards Best Free Course
 Pros
Pros
 Cons
Cons
-
- Emphasis on graphical analysis creates a strong point that many other courses overlook or minimize.
- Covers a wide range of analytic techniques.
- Course deeply covers R, which is vital to analytic presentation.
-
- Course doesnt really get out of graphics systems, severely limiting the amount of exploratory data analysis that really happens.
- Theory is lacking in this course.
- Course outlines what data analysis consists of more than how to perform exploratory analysis.
 Instructor Details

- 4.9 Rating
 108 Reviews
Roger D. Peng
Roger D. Peng is a Professor of statistics at the Johns Hopkins Bloomberg School of Public Health and a Co-Editor of the Simply Statistics blog. He received his Ph.D. in Statistics from the University of California, Los Angeles and is a prominent researcher in the areas of air pollution and health risk assessment and statistical methods for environmental data. He is the recipient of the 2016 Mortimer Spiegelman Award from the American Public Health Association, which honors a statistician who has made outstanding contributions to health statistics. He created the course Statistical Programming at Johns Hopkins as a way to introduce students to the computational tools for data analysis. Dr. Peng is also a national leader in the area of methods and standards for reproducible research and is the Reproducible Research editor for the journal statistics. His research is highly interdisciplinary and his work has been published in major substantive and statistical journals, including the Journal of the American Medical Association and the Journal of the Royal Statistical Society. Dr. Peng is the author of more than a dozen software packages implementing statistical methods for environmental studies, methods for reproducible research, and data distribution tools. He has also given workshops, tutorials, and short courses in statistical computing and data analysis.
 Reviews
- Video Duration:
 5h
5h - Price: Free 0 Track Price
- Provider:
 Coursera
 - University:
 Johns Hopkins University
 - Year:
 2016
2016 - Level:
 Beginner
 - Language:
 English
 - Certificate:
 Yes
Yes
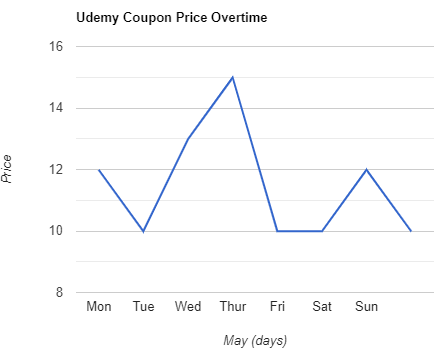
Coursera Coupon Price Tracker