Information Visualization: Programming with D3.js
This specialization provides learners with the necessary knowledge and practical skills to develop a strong foundation in information visualization and to design and develop advanced applications for visual data analysis.The specialization is characterized by two main complementary features: (1) providing a strong understanding of visual perception and the theory of visual encoding to design and evaluate innovative visualization methods; (2) providing the necessary skills to develop advanced web-based applications for visual data analysis.The specialization is organized around four courses tha
Created by: Enrico Bertini
 Quality Score
Content Quality
/
Video Quality
/
Qualified Instructor
/
Course Pace
/
Course Depth & Coverage
/
Overall Score : 88 / 100
 Live Chat with CourseDuck's Co-Founder for Help
Need help deciding on a css course? Or looking for more detail on Enrico Bertini's Information Visualization: Programming with D3.js? Feel free to chat below.
Join CourseDuck's Online Learning Discord Community
 Course Description
In this course you will learn how to use D3.js to create powerful visualizations for web. Learning D3.js will enable you to create many different types of visualization and to visualize many different data types. It will give you the freedom to create something as simple as a bar chart as well your own new revolutionary technique. In this course we will cover the basics of creating visualizations with D3 as well as how to deal with tabular data, geography and networks. By the end of this course you will be able to:- Create bar and line charts- Create choropleth and symbol maps- Create node-link diagrams and tree maps- Implement zooming and brushing- Link two or more views through interactionThe course mixes theoretical and practical lectures. We will show you step by step how to use the library to build actual visualizations and what theoretical concepts lie behind them. Throughout the course you will learn skills that will lead you to building a whole application by the end of the lectures (a fully working visualization system to visualize airlines routes).This course is the third one of the "Specialization in Information Visualization". The course expects you to have some basic knowledge of programming as well as some basic visualization skills.
 Instructor Details

- 4.4 Rating
 96 Reviews
Enrico Bertini
Enrico Bertini is Associate Professors in the Computer Science and Engineering department at NYU Tandon School of Engineering. He has taught courses on visualization and visual analytics for more than 10 years in public and private institutions across Europe and the United States. Prof. Bertini's research focuses on the development and evaluation of advanced visual interfaces for Data Science. He has numerous publications top visualization conferences and journals and he is the recipient of several awards for his research. He is also the co-host of Data Stories, a popular podcast on data and data visualization.
 Reviews

- Video Duration:
 23h
23h - Price: Free 0 Track Price
- Provider:
 Coursera
 - University:
 New York University Tandon School of Engineering
 - Language:
 English
 - Certificate:
 Yes
Yes
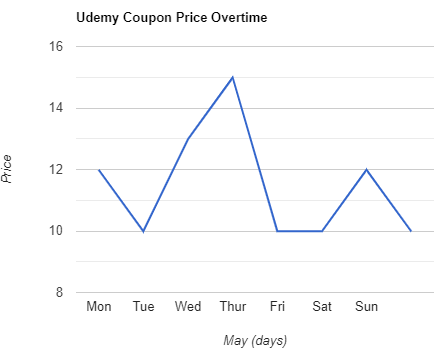
Coursera Coupon Price Tracker