Essential Design Principles for Tableau
In 2021 the world will generate 50 times the amount of data as in 2011. And 75 times the number of information sources (IDC, 2011). Being able to use this data provides huge opportunities and to turn these opportunities into reality, people need to use data to solve problems.This Specialization, in collaboration with Tableau, is intended for newcomers to data visualization with no prior experience using Tableau. We leverage Tableau's library of resources to demonstrate best practices for data visualization and data storytelling. You will view examples from real world business cases and journal
Created by: Govind Acharya
 Quality Score
Overall Score : 84 / 100
 Live Chat with CourseDuck's Co-Founder for Help
 Course Description
 Instructor Details

- 4.2 Rating
 131 Reviews
Govind Acharya
Govind Acharya is a Principal Analyst in the UC Davis Budget and Institutional Office. In his position, he is responsible for developing and implementing data visualizations on a variety of institutional related data such as classroom utilization, faculty, staff, and students. At Ithaca College, he developed some of the first Tableau dashboards and developed a set of best practices still in use today. He is a graduate of the University of California, San Diego and did his graduate work at San Francisco State University and Cornell University in Economics. He is on the Board of Directors of Amnesty International USA, the world's largest and best known human rights organizations.
 Students also recommend

-
Python A-Z: Python For Data Science With Real Exercises! (2022)
-
4.4 (150 Reviews)
-
 Provider: Udemy
 Time: 11h
$10.44
 Reviews

- Video Duration:
 14h
14h - Price: Free 0 Track Price
- Provider: Coursera
- University:
 University of California, Davis
 - Language:
 English
 - Certificate:
 Yes
Yes
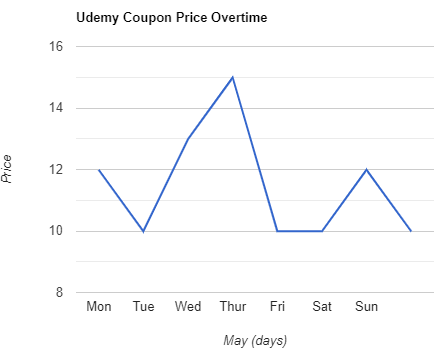
Coursera Coupon Price Tracker