Excel PRO TIPS: 75+ Tips to go from Excel Beginner to Pro (Udemy.com)
Excel tips & hands-on demos to become an Excel POWER USER. Learn Excel formulas, pivot tables, charts, analytics & more!
Created by: Maven Analytics
Produced in 2022
 What you will learn
- Build tools to help you automate, streamline, and absolutely revolutionize your workflow with Excel
- Explore 75+ unique tips, tools and case studies that you won't find in ANY other Excel course, guaranteed
- Get LIFETIME access to resources, Excel project files, quizzes, and 1-on-1 expert support
- Master Excel's powerful data analysis tools like Goal Seek, Scenario Manager, Solver, and Analysis ToolPak
- Practice with fun, interactive, and highly effective lessons from a best-selling Excel instructor
- Become an absolute Excel POWER USER
 Quality Score
Overall Score : 98 / 100
 Live Chat with CourseDuck's Co-Founder for Help
 Course Description
"At first I just said to myself, "Wow, Excel is capable of that? It's amazing!" Then as I continued through the course I told myself "This guy is doing magic!", and now I feel like I'm capable of doing the same. I'm definitely buying his other Excel courses!"
- Judit Bekker
"One of the very best Excel classes I've taken - great instructor, awesome production, very comprehensive and exceptionally useful. Well worth your time if you want to become an Excel pro!"
- Ernie Atkins
"I've been using Excel for over 20 years and consider myself to be an Excel "power user". As with every single course by Chris, I go in with pretty solid knowledge of the material (formulas, VBA, Power Query, etc) and walk out twice as powerful as I walked in. This course is no different -- I PROMISE you, you will find absolute gems in this course. You will never regret an investment in your future with Maven Analytics!"
-Ryan Hughes
__________
COURSE DESCRIPTION:
This course is NOT an introduction to Excel.
It's not about comprehensive, 101-style deep dives into Excel's core capabilities, or about showing off cheesy, impractical Excel "hacks". It's about featuring some of the most powerful and effective tools and techniques used by Excel professionals, and sharing them through crystal clear demos and unique, real-world case studies.
Unlike most Excel courses, this one is non-linear and constantly evolving. This means that you can jump to different sections or individual lectures freely, and explore brand new Excel tips added on a regular basis. Each video is designed to be an independent and self-contained Excel demo, to help you learn these tools and techniques in quick, bite-sized lessons.
The best part? I'm including a downloadable Excel workbook and solution file containing every single Excel demo and dataset covered in the course -- ranked by difficulty (1-5 stars), organized by category, and hyperlinked for quick and easy access.
__________
The Excel tips and techniques covered in this course fall into six categories:
- Excel Productivity Tips (navigation, flash fill, cell protection, advanced sorting & filtering, etc.)
- Excel Formatting Tips (freeze panes, row/column grouping, advanced custom formats, etc.)
- Excel Formula Tips (formula auditing tools, fuzzy lookups, detecting duplicates, randomization, etc.)
- Excel Visualization Tips (sparklines, filled maps, custom templates, Excel form controls, etc.)
- Excel Pivot Table Tips (slicers & timelines, custom layouts, value calculations, etc.)
- Excel Analytics Tips (outlier detection, monte carlo simulation, forecasting, CUBE functions, etc.)
While the level of difficulty varies considerably, the Excel demos generally start simple and become progressively more complex within each section. There are no strict prerequisites for this course, but keep in mind that some demos may be challenging without a strong foundational knowledge of the underlying Excel concepts (like Excel Pivot Tables or formulas, for example).
Students who have completed the full Maven Analytics Excel stack will be well-positioned to maximize the value from this course:
- Advanced Excel Formulas & Functions
- Data Visualization with Excel Charts & Graphs
- Data Analysis with Excel Pivot Tables
- Excel Power Query, Power Pivot & DAX
It's time to start working smarter, not harder. If you're looking to maximize your efficiency, supercharge your productivity, and become an absolute Excel POWER USER, this is the course for you.
See you in there!
-Chris (Founder, Excel Maven & Maven Analytics)
__________
NOTE: Most Excel demos are compatible with Excel 2007, Excel 2010, Excel 2013, Excel 2016, Excel 2019 or Office 365 (some may be unavailable in Excel for Mac or Excel Online)
__________
P.S. Looking to master the full Microsoft Excel, Power BI + SQL stack? Search for "Maven Analytics" and complete the courses below to become a business intelligence ROCKSTAR:
- Excel Pro Tips for Power Users
- Advanced Excel Formulas & Functions
- Data Visualization with Excel Charts & Graphs
- Data Analysis with Excel PivotTables
- Excel Power Query, Power Pivot & DAX
- Up & Running with Power BI Desktop
- Publishing to Power BI Service
- SQL Database Analysis for Beginners
- Advanced MySQL for Analytics & Business Intelligence
- Excel users looking to level-up and master the same tools and techniques used by Excel MVPs
- Anyone hoping to maximize productivity, work more efficiently, and take their career to a new level
- Students looking for an engaging, hands-on, and highly interactive approach to Excel training
- Anyone looking to pursue a career in data analysis or business intelligence
- This course is NOT recommended for absolute beginners (some prior experience with Excel is encouraged)

*Some courses are excluded from this sale. Coupon not working? If the link above doesn't drop prices, clear the cookies in your browser and then click this link here.
Also, you may need to apply the coupon code directly on the cart page to get the discount.
 Instructor Details

- 4.9 Rating
 100 Reviews
Maven Analytics
Maven Analytics transforms everyday people into data rockstars by streamlining, simplifying, and personalizing the online learning experience.
Since 2014 we've helped students and teams across 190 countries develop the most sought-after analytics skills, through on-demand courses, personalized skills assessments, curated learning paths, and enterprise training.
Learning new skills shouldn't be complicated. Think of Maven as your personal team of instructors, experts, mentors and guides, helping you navigate the learning process and develop the skills you need, on-demand.Chris Dutton is a professional BI developer, certified Microsoft expert, and best-selling Udemy instructor with more than a decade of experience specializing in business intelligence, marketing analytics and data visualization.
He founded Excel Maven and Maven Analytics in 2014 to provide high-quality, applied analytics training and consulting to clients around the world, and now mentors 100,000+ students in more than 185 countries. He has developed award-winning data analytics and visualization tools, which have been featured by Microsoft, the New York Times, and the Society of American Baseball Research.
Current Udemy courses include:
- Advanced Excel Formulas & Functions (English & Spanish)
- Data Visualizat
 Students also recommend
-
Microsoft Excel - Online Tutorial for Beginners (2010)
-
0.0 (0 Reviews)
-
 Provider: Chandoo.org
 Time: 1h 30m
Free
 Reviews
- Video Duration:
 10.5h
10.5h - Price: 11.99 Track Price 11.99 Track Price
- Provider: Udemy
- Year:
 2022
2022 - Language:
 English, English [Auto-generated]
 - Certificate:
 Yes
Yes

30-Day Money-Back Guarantee
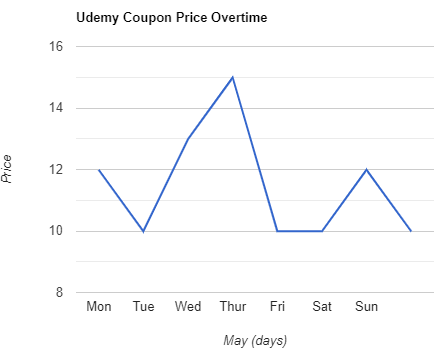
Udemy Coupon Price Tracker