Learn Microsoft Excel 2010 Advanced Course (Udemy.com)
Learn advanced Excel 2010 features and get ready to take your Excel knowledge to the next level.
Created by: Simon Sez IT
Produced in 2018
 What you will learn
- Four basic steps to consider when creating charts and graphs.
- How to better format your charts and graphs like professionals do.
- Discover how to deal with complex trends in your charts and graphs.
- Learn how to use a bar chart and a pie chart to accentuate the differences in a data set.
- Discover the tools and options for exporting your charts and graphs.
- Discover the limitations of pie charts and the best way to correct them.
- Learn how to use Pivot Tables and Pivot Charts.
- Learn how to integrate graphics into your spreadsheets.
 Quality Score
Overall Score : 88 / 100
 Live Chat with CourseDuck's Co-Founder for Help
 Course Description
- Downloadable & printable keyboard shortcuts - to help you save time and get your work done faster.
- An online quiz (35 questions) - to test what you've learned.
- Downloadable & printable transcripts (over 120 searchable pages) to give you another learning option, if you prefer reading but don't have time to take notes.
- 7 hours of downloadable MP3s to play on your favorite audio device - to help you learn in the car, while you walk, or in the gym.
- A certificate of completion to tell everyone you've aced the course.
- Those seeking advanced Excel training

*Some courses are excluded from this sale. Coupon not working? If the link above doesn't drop prices, clear the cookies in your browser and then click this link here.
Also, you may need to apply the coupon code directly on the cart page to get the discount.
 Instructor Details

- 4.4 Rating
 76 Reviews
Simon Sez IT
Since 2008, individuals, small businesses, and Fortune 500 companies with thousands of employees have benefited from the easy and hands-on software training offered by Simon Sez IT. With over 5,000 video tutorials on a range of software programs, Simon Sez IT ensures stress-free eLearning and enhanced employee productivity - no matter whether you are implementing new software or a technological upgrade for your workplace. With over 380,000 Udemy students in over 180 countries, Simon Sez IT is the preferred eLearning choice for individuals and businesses everywhere.
 Students also recommend
-
Microsoft Excel - Online Tutorial for Beginners (2010)
-
0.0 (0 Reviews)
-
 Provider: Chandoo.org
 Time: 1h 30m
Free
 Reviews
- Video Duration:
 7h
7h - Price: 11.99 Track Price 11.99 Track Price
- Provider: Udemy
- Year:
 2018
2018 - Language:
 English, English [Auto-generated]
 - Certificate:
 Yes
Yes

30-Day Money-Back Guarantee
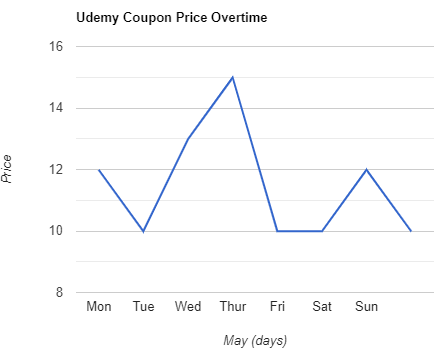
Udemy Coupon Price Tracker