Microsoft Excel - Data Analysis with Excel Pivot Tables (Udemy.com)
Master Excel Pivot Tables & data analysis with real-world cases from a best-selling Excel instructor (Excel 2010-2019)
Created by: Maven Analytics
Produced in 2022
 What you will learn
- Take your data analysis skills from ZERO to PRO with Excel Pivot Tables
- Learn how to use Pivot Tables and Pivot Charts to streamline and absolutely revolutionize your workflow in Excel
- Master unique Pivot Table tips, tools and case studies that you won't find in ANY other course, guaranteed
- Explore fun, interactive, and highly effective lessons from a best-selling Excel instructor
- Get LIFETIME access to project files, quizzes, homework exercises, and 1-on-1 expert support
- Test your skills with 10 real-world Pivot Table case studies (weather, shark attacks, wine tastings, burrito ratings, and more!)
 Quality Score
Overall Score : 98 / 100
 Live Chat with CourseDuck's Co-Founder for Help
 Course Description
"This is a great Excel course. You can feel confident putting these skills on your resume, and the lectures are in-depth and easy to follow. I would highly recommend this course to anyone who wants to not just LEARN Excel Pivot Tables, but become a true Pivot Table EXPERT"
-Monique C.
"Chris provides clear, detailed explanations and shows how to use Excel Pivot Tables to extract hidden details and facts using raw, real-life data sets in Excel. The quizzes and homework reinforce the lessons and the course layout makes it easy to go back to sections that need revision. This course is exactly what I was looking for to master Excel Pivot Tables. Thanks, Chris!"
-Paul M.
"One of the very best Excel classes I've taken - great instructor, awesome production, very comprehensive and exceptionally useful. I have added other Excel and Pivot Table courses from Chris & Maven Analytics and look forward to viewing them as well."
-Ernie A.
__________
FULL COURSE DESCRIPTION:
Excel Pivot Tables are an absolutely essential tool for anyone working with data in Excel.
Pivots allow you to quickly explore and analyze raw data in Excel, revealing powerful insights and trends otherwise buried in the noise. In other words, they give you answers. Whether you're exploring product sales, analyzing which marketing tactics drove the strongest conversion rates, or wondering how condo prices have trended over the past 10 years, Excel Pivot Tables provide fast, accurate and intuitive solutions to even the most complicated analytics questions.
This course gives you a deep, 100% comprehensive understanding of Excel Pivot Tables and Excel Pivot Charts. I'll show you when, why, and how to use Excel Pivot Tables, introduce advanced sorting, filtering, and calculation tools, and guide you through interactive, hands-on demos and Excel exercises every step of the way.
__________
We'll start by covering everything you need to know to get up and running with Excel Pivot Tables, including:
- Raw data structure in Excel
- Pivot Table layouts & styles
- Design & formatting options
- Sorting, filtering, & grouping tools
- Calculated fields, items & values
- Pivot Charts, slicers & timelines
- Interactive Excel dashboards
We'll then explore and analyze Excel datasets from a number of real-world case studies, including:
- San Diego burrito ratings
- Shark attack records from 1900-2016
- Facebook Post data from Spartan Race
- Major League Baseball team statistics
- San Francisco employee salaries
- Daily stock market data
- IMDb movie ratings
- Apple Store mobile app ratings
- Wine ratings and descriptions
Whether you're looking for a quick Excel Pivot Table primer, trying to diversify your Excel skill set, or hoping to step up your analytics game in a major way, you've come to the right place. In today's increasingly data-driven world, analytics skills are in short supply and incredibly high demand, and those with the ability to transform data into insight are leading the charge. Enroll today and start your journey to becoming an Excel analytics pro!
See you there!
-Chris (Founder, Excel Maven & Maven Analytics)
__________
NOTE: Full course includes downloadable resources and Excel project files, homework and course quizzes, lifetime access and a 30-day money-back guarantee. Most lectures compatible with Excel 2007, Excel 2010, Excel 2013, Excel 2016, Excel 2019 or Office 365.
__________
P.S. Looking to master the full Microsoft Excel, Power BI + SQL stack? Search for "Maven Analytics" and complete the courses below to become a business intelligence ROCKSTAR:
- Excel Pro Tips for Power Users
- Advanced Excel Formulas & Functions
- Data Visualization with Excel Charts & Graphs
- Data Analysis with Excel PivotTables
- Excel Power Query, Power Pivot & DAX
- Up & Running with Power BI Desktop
- Publishing to Power BI Service
- SQL Database Analysis for Beginners
- Advanced MySQL for Analytics & Business Intelligence
- ANYONE who works with Excel on a regular basis (even if you've never used a Pivot Table!)
- Excel users who have basic skills but would like to become more proficient in data exploration and analysis
- Students looking for a comprehensive, engaging, and highly interactive approach to training
- Anyone looking to pursue a career in data analysis or business intelligence

*Some courses are excluded from this sale. Coupon not working? If the link above doesn't drop prices, clear the cookies in your browser and then click this link here.
Also, you may need to apply the coupon code directly on the cart page to get the discount.
 Instructor Details

- 4.9 Rating
 100 Reviews
Maven Analytics
Maven Analytics transforms everyday people into data rockstars by streamlining, simplifying, and personalizing the online learning experience.
Since 2014 we've helped students and teams across 190 countries develop the most sought-after analytics skills, through on-demand courses, personalized skills assessments, curated learning paths, and enterprise training.
Learning new skills shouldn't be complicated. Think of Maven as your personal team of instructors, experts, mentors and guides, helping you navigate the learning process and develop the skills you need, on-demand.Chris Dutton is a professional BI developer, certified Microsoft expert, and best-selling Udemy instructor with more than a decade of experience specializing in business intelligence, marketing analytics and data visualization.
He founded Excel Maven and Maven Analytics in 2014 to provide high-quality, applied analytics training and consulting to clients around the world, and now mentors 100,000+ students in more than 185 countries. He has developed award-winning data analytics and visualization tools, which have been featured by Microsoft, the New York Times, and the Society of American Baseball Research.
Current Udemy courses include:
- Advanced Excel Formulas & Functions (English & Spanish)
- Data Visualizat
 Students also recommend
-
Microsoft Excel - Online Tutorial for Beginners (2010)
-
0.0 (0 Reviews)
-
 Provider: Chandoo.org
 Time: 1h 30m
Free
 Reviews
- Video Duration:
 6.5h
6.5h - Price: 11.99 Track Price 11.99 Track Price
- Provider: Udemy
- Year:
 2022
2022 - Language:
 English, English [Auto-generated], French [Auto-generated], 5 more
 - Certificate:
 Yes
Yes

30-Day Money-Back Guarantee
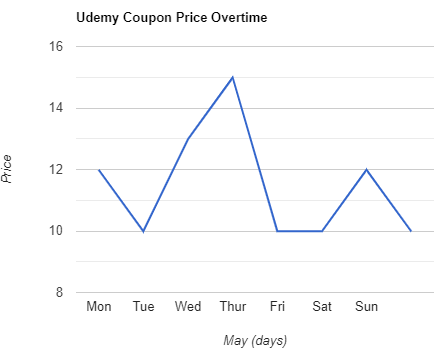
Udemy Coupon Price Tracker