Understanding and Visualizing Data with Python
This specialization is designed to teach learners beginning and intermediate concepts of statistical analysis using the Python programming language. Learners will learn where data come from, what types of data can be collected, study data design, data management, and how to effectively carry out data exploration and visualization. They will be able to utilize data for estimation and assessing theories, construct confidence intervals, interpret inferential results, and apply more advanced statistical modeling procedures. Finally, they will learn the importance of and be able to connect research
Created by: Brenda Gunderson
 Quality Score
Overall Score : 90 / 100
 Live Chat with CourseDuck's Co-Founder for Help
 Course Description
 Instructor Details

- 4.5 Rating
 72 Reviews
Brenda Gunderson
Brenda Gunderson received her PhD in Statistics from The University of Michigan in 1989. She has stayed on at UM and is a Senior Lecturer. She coordinates and teaches the largest undergraduate statistics course, Statistics and Data Analysis, with approximately 1800 students each term. She is also an undergraduate advisor for students electing to major or minor in Statistics. Her research focuses on Statistical Education, in particular using technology to enhance teaching and learning. Brenda received the UM Teaching Innovation Prize for her work on Infusing Technology for Guided Continuous Learning in a Large Gateway Course. She is co-investigator for a UM grant called: Enhancing Undergraduate Education through the Deployment of Quality Learning Objects. Her work on this grant led to receiving the Innovative Use of MERLOT Award (2009) and a Sloan-C Effective Practice Award (2012). She is also part of an NSF project to expand the UM E2Coach system (Expert Electronic Coaching) to students in introductory statistics courses -- computer tailored communication technology allows us to provide individualized coaching and advice to students using their individual background, goals, and current standing in the course.
 Students also recommend

-
Python A-Z: Python For Data Science With Real Exercises! (2022)
-
4.4 (150 Reviews)
-
 Provider: Udemy
 Time: 11h
$10.44
 Reviews
- Video Duration:
 22h
22h - Price: Free 0 Track Price
- Provider: Coursera
- University:
 University of Michigan
 - Language:
 English
 - Certificate:
 Yes
Yes
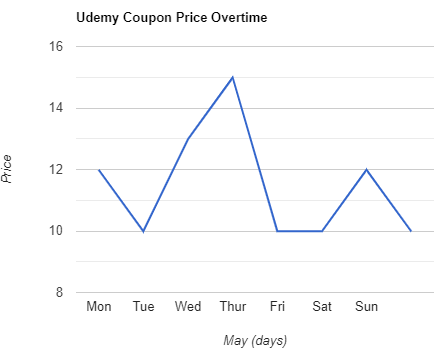
Coursera Coupon Price Tracker