Build Insightful Dashboards with Google Data Studio (Udemy.com)
Create powerful data visualisations within minutes from google analytics and google sheets to speed up time to insight
Created by: Annabel Lyle
Produced in 2022
 What you will learn
- Connect to a range of Data Sources (Google Analytics, Google Sheets)
- Get started with a FREE Data Studio Account
- Create and customise a range of data visualisations (scorecards, time series charts, bar charts, area charts, tables)
- Create re-usable report templates that follow best practice principles to share with collegues
- Create advance visualisations (maps, scatter charts, bullet charts)
- Add dynamic date and dimension filters to make dashboards interactive
- Tell powerful stories from your data
- Confidently create interactive analytical dashboards with your own Data
- Complete a final assignment and receive feedback on your final dashboard
 Quality Score
Overall Score : 92 / 100
 Live Chat with CourseDuck's Co-Founder for Help
 Course Description
Overview of The Explorer feature in Data Studio and how it can help you to reach insights faster!
This course also now supports Captions in English to help support your learning.
The Power of Data Studio
- Intuitive Design - create dashboard designs that are more intuitive than dashboards in GA & Google Sheets
- Scale your insights - build shareable dashboards saved in Google Drive
- Speed up time to insight - build reports and visualisations to answer questions within minutes
- User friendly Templates and Layouts - will make it easier for users to interpret the data.
Data Studio is FREE and allows you to connect to a range of data sources.
It's an incredible tool to create powerful and interactive dashboards for you to explore your underlying data.
I look forward to showing you how powerful Data Studio is for speeding up time to insight.
Target Audience
This course is for anyone who wants to learn how to find meaning from their data and communicating insights through great dashboards.
Your role might fall into one of the following
- Online Marketer
- Product Analyst
- Data Analyst
- Product Owners/Manager
- Small business Owner
- Google Analytics, Adwords or other Google Product
- Google Sheets
- Excel
1. Connecting to many data sources
2. Visualising data through a range of customisable reports and widgets
3. Sharing dashboards for collaboration and communicating insights.
NEW LECTURE (May 2018)
Asking the question is Data Studio the right tool for me? In this new lecture 'Why Data Studio?' I explore how you can evaluate how Data Studio fits within your existing toolset and how to evaluate Data Studio against other Business Intelligence Tools in the market.
NEW ASSIGNMENT! (April 2018)
To ensure you have even more hands-on experience there is now an Assignment at the end of the course for you to complete! You will create a dashboard from scratch and answer key questions about the data set to pass the assignment and receive feedback on your final Data Studio Report.
NEW LECTURES! (DEC 2017)
- Calculated Metrics - Simple Arithmetic - Learn how to create new metrics from your existing data sets directly in Data Studio, to explore your data in new ways
- Handling Sampling of Google Analytics Data in Data Studio
NEW LECTURES (AUG 2017)
- Prepare your data in Google Sheets for Data Studio
- Connecting Google Sheets to Data Studio
- Connect your own Google Analytics Data to Power your reports
NEW LECTURES (SEPT 2017)
- Tracking Usage of your Data Studio Reports
Who this course is for:
- Anyone who wants to learn how to tell stories from data using dashboards
- Improve your analytical skills and capabilities
- Users of Google Analytics, Google Sheets, Excel or a Database
- Data Analysts/Online Marketers/Product Owners/ Business Intelligence Analysts/Business Owners

*Some courses are excluded from this sale. Coupon not working? If the link above doesn't drop prices, clear the cookies in your browser and then click this link here.
Also, you may need to apply the coupon code directly on the cart page to get the discount.
 Instructor Details

- 4.6 Rating
 50 Reviews
Annabel Lyle
My name is Annabel and I have over 5 years of experience as a Data Analyst within Marketing and Product Teams. I have also mentored and taught individuals and teams how to get the most out of a range of data visualisation tools, to ensure they have the greatest impact. My expertise is in storytelling with data, data visualisation and data analysis. Key tools that I teach and work with include Data Studio, Google Analytics, Google Tag Manager and R Studio.
 Reviews

- Video Duration:
 2h
2h - Price: 11.99 Track Price 11.99 Track Price
- Provider:
 Udemy
Udemy - Year:
 2022
2022 - Language:
 English, English [Auto-generated]
 - Certificate:
 Yes
Yes

30-Day Money-Back Guarantee
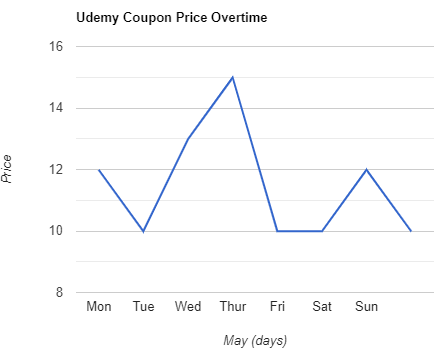
Udemy Coupon Price Tracker