
 Web Development
 Data Science
 Python
 SQL
 JavaScript
 Artificial Intelligence
 IT & Software
 IT Certifications
 Hacking
 AWS
 Arduino
 DevOps
 3D Modeling
 Graphic Design
 Photoshop
 Drawing
 Digital Painting
 UX Design
 Business
 Data Analysis
 Communication Skills
 Project Management
 Leadership & Management
 Human Resources
 Digital Marketing
 Social Media Marketing
 Marketing
 SEO
 Google Analytics
 Branding
 Excel
 Office Productivity
 SAP
 PowerPoint
 Microsoft Access
 SharePoint
 Finance & Accounting
 Trading & Investing
 Accounting
 Bitcoin
 Personal Finance
 Video Editing & Animation
 Photography
 Adobe Premier Pro
 Adobe Lightroom
 Personal Development
 Productivity
 Career Development
 Life Coaching
 Health & Fitness
 Meditation & Mindfulness
 Yoga
 Music
 Music Production
 Guitar
 Piano
 Singing
 Language Learning
 Teaching & Academics
 Engineering
 Math
 Lifestyle
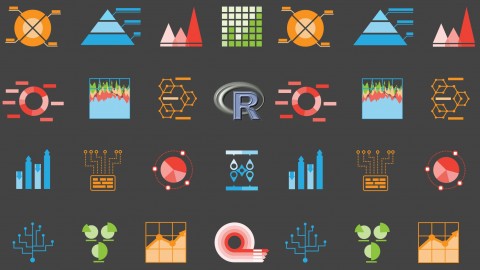
An Introduction to Data Visualization in R using ggplot (Udemy.com)
Make beautiful plots and graphs using the open source R programming language
Created by: Sophia Banton
Last updated June 2015
 What you will learn
- Prepare plots and graphs using R
- Create colorful maps in R
- Use the ggplot library in R to create high quality images
- Export plots as image files and PDFs
How it compares
Against the other 461 rated Udemy courses in Data Science on CourseDuck:
- Rating3.9 out of 5among the lower-rated ones
- Reviews42#451 of 462 by number of reviews
- Length5 hoursshorter than 67% of them
- Last updatedJune 2015earlier than 99% of them
 Course Description
How we represent our data is often as important as the quality of the data itself. In this course, you will learn how to make functional and elegant plots using the R language. R is a free/open source programming language that has become very popular in academia and among data scientists across all disciplines.
In this course, you will learn how to quickly make publication worthy
- Bar plots
- Scatter plots
- Line plots
- Pie charts
- Geographical maps
- and more...
You will also learn how to show trends over time and how to plot correlations and geographical data in this course.
This course is intended for students, professional, entrepeneurs and everyone in between.
Happy Plotting!

 Udemy Discount
The discount is applied through our link. Open the course from here and Udemy's current promotional price is applied at checkout on most courses, no code to type.
Some courses are excluded from Udemy's promotions. If the price does not drop, clear your browser cookies and use the button again.
Instructor Details

- 3.9 Rating
 42 Reviews
Sophia Banton
From Biology to Data Science
My journey began in biology, where I initially planned to pursue an MSc in Microbiology—until a single course changed everything. A class titled Bioinformatics I introduced me to computational biology, and within two weeks, I knew this was my future. I earned an MSc in Bioinformatics, followed by graduate studies in Bioengineering & Biostatistics (Public Health).
Science, Research & Teaching
I started as a bench scientist, studying bacterial growth, mutations, and viruses like HCV. But my love for data and technology led me into bioinformatics and omics research, analyzing complex biological data.
10+ Years Teaching College Science
Alongside research, I spent over a decade as a college instructor, teaching Microbiology, Human Anatomy & Physiology, and General Biology—helping students navigate the intersection of science and technology.
As science evolved, so did my curiosity—leading me to AI and its transformative potential.
 More Data Science courses




Master statistics & machine learning: intuition, math, code (2026)
4.9 (3,077 Reviews)
 Provider: Udemy
 Time: 38.3h
$124.99

 Reviews

By Swati on 8/8/2019
No, I was looking for more advanced course on graphs like to merge graphs, numerical methods like extrapolation, fitting but this just tells how to plot simple graphs.
By Paul Hengen on 2/7/2018
I'd like more detailed information about how gglplot works and how to program in R to create beautiful graphics. What is the underlying object that is created by ggplot and how do the functions alter this object? What exactly is "layering"? How is "layering" accomplished?
By Raihan Shafique on 10/7/2017
To the point. Instructor is focused on making sure you are able to do it on your own, and teaches some extra codes so that you find it easy to deal with your data which is praiseworthy. Excellent course to learn ggplot.
By Daniel Elisio on 8/24/2017
Should show example diagrams of 3 types of data/graphs sequential, categorical and the other one.
By Narina Nunez on 12/20/2016
Great coverage of all the material.
By Leonard Green on 7/30/2016
I like the instructor's approach. though I would prefer R Studio, i under stand why she is using R instead.
By Kevin Hampel on 5/9/2016
A brief introduction to ggplot2 , which unfortunately is only scratching the surface.
By Yu Jung Chen on 8/22/2015
really like it. the lectures are straightforward and very practical and lots of fun as well!
By Thọ Duy Nguyễn on 5/20/2015
There are a lot of strong feature of ggplot2 is missed.
By Sunday Ikpe on 7/1/2022
 Quality Score
No CourseDuck member has rated this course yet. Taken it? Give each part a thumbs up or down.
Overall Score : 78 / 100
- Video Duration:
 5h
- Price: $10.99
- Provider: Udemy
- Updated:
 June 2015
- Level:
 All Levels
- Language:
 English
- Certificate:
 Yes
30-day money-back guarantee on most paid courses
Udemy Coupon Price Tracker
