
 Web Development
 Python
 SQL
 JavaScript
 Data Science
 Artificial Intelligence
 IT & Software
 IT Certifications
 Hacking
 Arduino
 AWS
 3D Modeling
 Graphic Design
 Photoshop
 Drawing
 Digital Painting
 UX Design
 Business
 Data Analysis
 Communication Skills
 Project Management
 Leadership & Management
 E-Commerce
 Digital Marketing
 Social Media Marketing
 Marketing
 SEO
 Google Analytics
 Branding
 Office Productivity
 Excel
 Finance & Accounting
 Bitcoin
 Video Editing & Animation
 Photography
 Adobe Premier Pro
 Adobe Lightroom
 Personal Development
 Health & Fitness
 Music
 Guitar
 Teaching & Academics
 Language Learning
 Engineering
 Lifestyle
 Course Description
Microsoft Excel is an important tool for data analysis. It helps companies accurately assess situations and make better business decisions. This course helps you unlock the power of your organization's data using the data analysis and visualization tools built into Excel. Author Curt Frye starts with the foundational concepts, including basic calculations such as mean, median, and standard deviation, and provides an introduction to the central limit theorem. He then shows how to visualize data, relationships, and future results with Excel's histograms, graphs, and charts. He also covers testing hypotheses, modeling different data distributions, and calculating the covariance and correlation between data sets. Finally, he reviews the process of calculating Bayesian probabilities in Excel. Each chapter includes practical examples that show how to apply the techniques to real-world business problems.


 Related courses
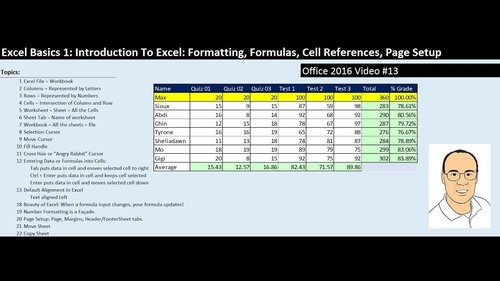
Microsoft Excel Data Analysis - Learn How The Experts Use It (2026)
5.0 (5,696 Reviews)
 Provider: Udemy
 Time: 3h
$39.99

More courses by Curt Frye


 Reviews
Showing 5-star reviews only
No reviews yet. Be the first to review this course!
Showing all 0 reviews
Could not load more reviews.
 Quality Score
No CourseDuck member has rated this course yet. Taken it? Give each part a thumbs up or down.
Content Quality
/
Video Quality
/
Qualified Instructor
/
Course Pace
/
Course Depth & Coverage
/
Overall Score : 0 / 100

- Video Duration:
 2h 9m
- Price: Free
- Provider: LinkedIn Learning
- Year:
 2019
- Level:
 Beginner
- Language:
 English
- Certificate:
 Yes
LinkedIn Learning Coupon Price Tracker
