
 Web Development
 Python
 SQL
SQL Data Science
 JavaScript
 Artificial Intelligence
 IT & Software
 IT Certifications
 Hacking
 Arduino
 AWS
AWS DevOps
 3D Modeling
 Graphic Design
 Photoshop
 Drawing
 Digital Painting
 UX Design
 Business
 Data Analysis
 Communication Skills
 Leadership & Management
 Project Management
 Human Resources
 Digital Marketing
 Social Media Marketing
 Marketing
 SEO
SEO Google Analytics
 Branding
 Excel
Excel Office Productivity
 SAP
SAP PowerPoint
 Microsoft Access
 SharePoint
 Finance & Accounting
 Trading & Investing
 Accounting
 Bitcoin
 Personal Finance
 Video Editing & Animation
 Photography
 Adobe Premier Pro
 Adobe Lightroom
 Personal Development
 Productivity
 Career Development
 Life Coaching
 Health & Fitness
 Meditation & Mindfulness
 Yoga
Yoga Music
Music Music Production
 Guitar
 Piano
Piano Singing
 Language Learning
 Teaching & Academics
 Engineering
 Math
Math Lifestyle
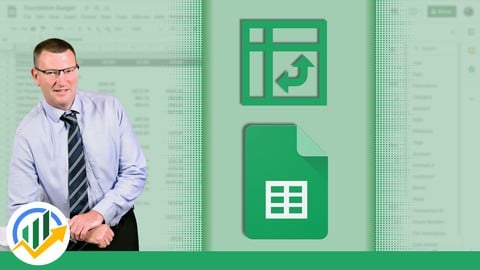
Complete Introduction to Google Sheets Pivot Tables (Udemy.com)
Summarize thousands of rows in Google Sheets with pivot tables, charts, filters and slicers - no formulas needed
Created by: Ian Littlejohn
Last updated September 2026
 What you will learn
- Structure your data so pivot tables work first time - the step most people skip
- Build pivot tables in Google Sheets that summarize thousands of rows in seconds
- Aggregate with Sum, Count, Unique Count, Average, Median, Max and Min, and combine them in one table
- Write custom calculated fields that answer questions the standard aggregations cannot
- Create comparison, stacked, line and area charts straight from your pivot table data
- Analyze trends over time using custom date fields, then chart them
- Filter and slice your data with text, number and date filters, and with interactive slicers
- Run contribution analysis to show what each product, region or customer is worth as a percentage of the whole
- Group and analyze HR data by age and salary band, and highlight what matters with conditional formatting
 Course Description
This course contains the use of artificial intelligence.
Every lesson in this course is written, created and recorded by me. AI is used only to help produce supporting images and written materials around the lessons.
Every month you rebuild the same report by hand. Sales by region. Headcount by department. Spend by category. You copy, you sort, you total, and next month you do it all again.
Pivot tables are how you stop. In Google Sheets you can summarize thousands of rows into an answer in about four clicks, chart it, filter it, and rebuild it next month without writing a single formula.
This course teaches that from start to finish in under three hours. It is for people who want Google Sheets to do the work for them.
WHAT YOU WILL BE ABLE TO DO
Structure your data so pivot tables work first time
Build pivot tables that summarize thousands of rows in seconds
Aggregate with Sum, Count, Unique Count, Average, Median, Max and Min
Write your own custom calculated fields
Create comparison, stacked, line and area charts from pivot table data
Analyze trends over time with custom date fields
Filter and slice your data with text, number and date filters, and with slicers
Run contribution analysis - what each product or region is worth as a percentage
Group and analyze HR data by age and salary band
Apply conditional formatting with rules and colour scales
HOW THE COURSE WORKS
Nine short sections, each opening with a one-minute overview. Teaching videos run four to seven minutes. Every section ends with a practical activity - a written brief you work through on the training data, followed by a walkthrough video showing you how I would do it. Download the training data in section one and build along with me.
You work on real sales and transaction data for most of the course, and a separate human resources data set for the frequency, age and salary grouping section. Both are provided.
ABOUT THE TRAINER
I have been training business people to work with data since 2008 and publishing on Udemy since 2013. I now have 16 courses on Udemy, more than 460,000 enrolments and more than 139,000 reviews, at an average rating of 4.6. This course is rated 4.7 from more than 3,500 ratings.
I specialise in teaching business users the analysis rather than just the tool - the methods that turn data into information you can act on - using Microsoft Excel, Google Sheets, Microsoft Power BI, Google Data Studio, Amazon QuickSight and Copilot in Excel.
WHAT STUDENTS ARE SAYING
"This course is really amazing i would say it's easy to understand and to follow"
"The size of the lessons are perfect, the instructor moves very clearly throughout each topic"
"Ian is a phenomenal trainer. The course is easy to follow, digest, and provides practical hands on experience"
Ready to stop rebuilding that report by hand? Start with section one and let's build your first pivot table.

 Udemy Discount
The discount is applied through our link. Open the course from here and Udemy's current promotional price is applied at checkout on most courses, no code to type.
Some courses are excluded from Udemy's promotions. If the price does not drop, clear your browser cookies and use the button again.
Instructor Details

- 4.8 Rating
 3,570 Reviews
Ian Littlejohn
I specialise in training business users to learn powerful methods and techniques to transform data into useful information and intelligence as well as learning strong data analysis methodology.
I completed my university degree in economics and emerged keen and eager to change the world. I spent the first half of my career working for multinational companies, on projects of various sizes, in different sectors, all revolving around analysing data of some sort and working with different software products, including Microsoft Excel.
I found that so many Excel users had a very basic understanding of how Excel works, and instead of using Excel to do the work for them, were doing all the work themselves, using old spreadsheet technology like macros instead of embracing technology like Pivot Tables. Pivot Tables were actually introduced into Excel in 1994 but many Excel users have avoided using them because they seem complicated and difficult to use.
In 2008 I decided to start my own training company and this was borne out of the passion I had to teach Excel users how to work smarter, not harder. As technology evolved, and new systems developed, I continuously expanded my training to include Power BI, Amazon QuickSight, Looker Studio, and most recently Copilot in Excel and Microsoft 365 Copilot.
 More courses by Ian Littlejohn

Complete Introduction to Microsoft Power BI (2026)
4.6 (51,162 Reviews)
 Provider: Udemy
 Time: 6.1h
$18.99

Business Data Analysis with Copilot in Excel & PivotTables (2026)
4.5 (24,354 Reviews)
- Provider: Udemy
- Time: 6.7h
$109.99

Power BI Master Class - Dashboards and Power BI Service (2026)
4.5 (12,178 Reviews)
- Provider: Udemy
- Time: 4.6h
$139.99

Complete Introduction to Data Studio (Looker Studio) (2026)
4.6 (9,704 Reviews)
- Provider: Udemy
- Time: 5.5h
$13.99

Power BI Master Class-Data Models and DAX Formulas (2026)
4.6 (8,151 Reviews)
- Provider: Udemy
- Time: 4.2h
$15.99
Excel Interactive Dashboards and Data Analysis (2026)
4.6 (7,109 Reviews)
- Provider: Udemy
- Time: 3.9h
$74.99
More Office Productivity courses

AI-Powered Social Media Management: From Beginner to Pro (2025)
5.0 (211 Reviews)
- Provider: Udemy
- Time: 1.1h
$19.99

Microsoft Excel + AI: Go From Data Analysis to Visualization (2026)
4.9 (276 Reviews)
- Provider: Udemy
- Time: 3.8h
$10.99


Microsoft Excel - Managing Personal Finances with Excel (2024)
4.8 (810 Reviews)
- Provider: Udemy
- Time: 3h
$19.99
SQL for Excel Users: Beginner-Friendly Guide for Excel Users (2025)
4.8 (703 Reviews)
- Provider: Udemy
- Time: 2.1h
$19.99

Learn Miro Step by Step: Maximize Your Productivity (2026)
4.8 (424 Reviews)
- Provider: Udemy
- Time: 1.4h
$10.99
 Reviews

By Mark D Ferbert on 7/25/2024
I already had reasonable knowledge of how to use Pivot tables in GSheets (having carried that knowledge over from Excel, but found that GSheets always being up to date edges Excel to the side). Found some good tips for other uses of pivot tables in this course though, and in particular the conditional formatting facilities which I haven't played with before (on pivot tables anyway). The charts section was also good and easy to follow
By Shannon Butera on 5/30/2024
This training was super helpful for me as I had zero knowledge of pivot tables coming into this. The sections were broken down into perfect segments where it's not overwhelming. I actually created my own pivot table for a work report before I even finished the course. I was so proud of myself! Thank you!
By Rachel Herron on 1/11/2024
Ian is a phenomenal trainer. The course is easy to follow, digest, and provides practical hands on experience. I was so surprised to see real world human resource data analysis included, which was super helpful. I would love to see this course for HR professionals. I've gained a tremendous amount of insight to creating powerful reports and data analysis. Thank you!
By Erika Vilar on 3/23/2023
Well explained. Easy to understand and to follow the directions. I wish the instructor went a little more in depth about adding Rows and Values. Utilizing more data and examples. Maybe showing an example of a graph showing the data collected.
By Kat L on 2/19/2022
I found this course focussed and really useful. It covered everything you might need to know about creating pivot tables in order to analyse your data. It also teaches how to create different kind of charts from that. It doesn't cover using formulas to analyse data (without a pivot table) which was something I didn't need to know so appreciated the focussed content.
By Anonymized User on 7/24/2020
Excellent course. There are a lot of practical exercises and examples to gain experience with creating and customizing pivot tables. All of the information was presented in a clear, easy to follow format. I'm extremely happy with the content that was provided! Thank you, I learned a lot.
By Claudine Adeyemi on 4/21/2020
Really great course to intro me to the basics as someone with extremely limited knowledge. Found some issues with it - answers provided in the practical activity being wrong and felt that the end of the course was pretty rushed. Expected much more from the Human Resource Data Analysis for example.
By Anonymized User on 3/13/2020
I learned some useful tricks that I did not know existed in Google sheets. E.g. creating your own groups from the data for frequency analysis and not only. Great course! Very easy to follow and very good training data sets. Thanks!
By Matthew DeFranza on 12/5/2019
This course was all that it was advertised to be. It also has the benefit of being concise and providing meaningful practical activities to reinforce the learning. Worth-while course for a beginner seeking the ability to build pivot tables and basic charts in Google Sheets.
By Sumit Banga on 4/7/2019
I am having good experience learning this course. Sheets are used a lot in my field of work. Reporting functions are good. Implementation of formulas and explanations regarding those are much appreciated during the course as well.
 Quality Score
No CourseDuck member has rated this course yet. Taken it? Give each part a thumbs up or down.
Overall Score : 96 / 100
- Video Duration:
 2.9h
2.9h - Price: $64.99
- Provider: Udemy
- Updated:
 September 2026
 - Level:
 All Levels
 - Language:
 English
 - Certificate:
 Yes
Yes
30-day money-back guarantee on most paid courses
Udemy Coupon Price Tracker
