
 Web Development
 Data Science
 Python
 SQL
 JavaScript
 Artificial Intelligence
 IT & Software
 IT Certifications
 Hacking
 AWS
 Arduino
 DevOps
 3D Modeling
 Graphic Design
 Photoshop
 Drawing
 Digital Painting
 UX Design
 Business
 Data Analysis
 Communication Skills
 Project Management
 Leadership & Management
 Human Resources
 Digital Marketing
 Social Media Marketing
 Marketing
 SEO
 Google Analytics
 Branding
 Excel
 Office Productivity
 SAP
 PowerPoint
 Microsoft Access
 SharePoint
 Finance & Accounting
 Trading & Investing
 Accounting
 Bitcoin
 Personal Finance
 Video Editing & Animation
 Photography
 Adobe Premier Pro
 Adobe Lightroom
 Personal Development
 Productivity
 Career Development
 Life Coaching
 Health & Fitness
 Meditation & Mindfulness
 Yoga
 Music
 Music Production
 Guitar
 Piano
 Singing
 Language Learning
 Teaching & Academics
 Engineering
 Math
 Lifestyle
Microsoft Excel: Business Intelligence w/ Power Query & DAX (Udemy.com)
Master Excel Power Query, Power Pivot & DAX for advanced data analysis & business intelligence w/ a top Excel instructor
Created by: Maven Analytics
Last updated June 2026
Our take
Based on the ratings of 29,351 students, a sample of their written reviews and the syllabus, as the course stood in June 2026. No course pays to be reviewed.
This is a 7.3 hour course on the three tools behind Excel's modern BI stack: Power Query for pulling and cleaning data, the data model for linking tables, and Power Pivot with DAX for analysis. It runs 88 lectures across seven sections and builds one project from start to finish. The syllabus assumes comfort with PivotTables and basic formulas. It also needs a Windows version of Excel, since Power Query and Power Pivot are not available on Mac.
Students are warm about Chris Dutton's teaching. Reviewers say he explains concepts so they click, that his pro tips matter, and that the homework tasks help cement ideas. One reviewer has gifted the courses to coworkers. The complaints are small and specific. A couple of reviewers say the audio is very low, one noting that only the intro video had good volume, and one gave a single star over it. Another found it a bit fast, and one wanted smaller step-by-step modeling exercises. A reviewer new to Excel suggests starting with a beginner course first.
The numbers back up the mood. Of 29,351 ratings, about 19,300 are five stars and fewer than 200 are one or two stars. It was last updated in June 2026, so it is current. At roughly 7 hours it covers a lot, with the DAX functions section taking nearly three hours of it. It is a good pick for a PivotTable user on Windows who wants solid DAX basics fast.
Pros
- Builds one data model from Power Query through DAX, so each section feeds the next
- Reviewers say Chris Dutton's explanations make concepts click, and his pro tips are useful
- Homework tasks help cement the ideas, according to students
- Updated in June 2026 and rated 4.7 across 29,351 reviews
Cons
- Reviewers say the audio is very low, even with every volume control turned up
- Pace can run a little fast, and one reviewer wanted smaller step-by-step modeling exercises
- Windows-only tools, and PivotTable experience is expected before you start
Chris Dutton explains and phrases everything so all these concepts click on a foundational level.
Listed for all levels, but the requirements expect working PivotTable and formula skills, so it suits intermediate Excel users.
 What you will learn
- Get up and running with MS Excel's powerful data modeling & business intelligence tools
- Learn how to use Power Query, Power Pivot & DAX to revolutionize your data analysis workflow in Excel
- Master unique tips, tools and case studies that you won't find in ANY other course
- Explore fun, interactive, and highly effective lessons from a best-selling Microsoft Excel instructor
- Get LIFETIME access to project files, quizzes and homework exercises, and 1-on-1 expert support
- Build pro-quality business intelligence solutions to blend and analyze data from multiple sources
Course content
7 sections · 88 lectures · 7.3 hours of video 5 quizzes, 13 articles
- 1Getting Started 3 free previews6 lectures · 10 min
- 2Intro to “Power Excel" 1 free preview4 lectures · 1 quiz · 13 min
- 3Connecting & Transforming Data with Power Query in Excel 2 free previews20 lectures · 1 quiz · 1.8 hours
- 4Building Table Relationships with Excel's Data Model 1 free preview16 lectures · 1 quiz · 1 hour
- 5Analyzing Data with Power Pivot & DAX 1 free preview14 lectures · 1 quiz · 1.1 hours
- 6Common DAX Formulas & Functions 1 free preview24 lectures · 1 quiz · 2.8 hours
- 7Wrapping Up 2 free previews4 lectures · 13 min
Who it is for
The instructor says it suits
- Excel users who want to learn advanced data analysis, modeling & business intelligence tools
- Students looking for a comprehensive, engaging, and highly interactive approach to Microsoft Excel training
- Anyone looking to become an Excel POWER USER and supercharge their analytics skillset
- Students looking to pursue a career in data analysis, data science or business intelligence
What you need before you start
- Microsoft Office 365, or a version of Excel compatible with Power Query & Power Pivot (2016+)
- Experience with Excel PivotTables and formulas & functions is strongly recommended
How it compares
Against the other 355 rated Udemy courses in Excel on CourseDuck:
- Rating4.7 out of 5higher than 81% of them
- Reviews29,351#17 of 356 by number of reviews
- Length7.3 hourslonger than 59% of them
- Last updatedJune 2026more recently than 87% of them
 Course Description
This course introduces Microsoft Excel's powerful data prep, modeling, analytics and business intelligence tools: Power Query, Power Pivot, and Data Analysis Expressions (DAX).
If you're looking to become a power Excel user and absolutely supercharge your Excel analytics game, this course is the A-Z guide that you're looking for. I'll introduce the "Power Excel" landscape, and explore what these Excel tools are all about and why they are changing the world of self-service analytics and business intelligence.
Together, we'll walk through the Excel BI workflow, and build an entire Excel data model from scratch:
First we'll get hands-on with Power Query; a tool to extract, transform, and load data into Excel from flat files, folders, databases, API services and more. We'll practice shaping, blending, cleaning and exploring our project files in Excel's query editor, and create completely automated loading procedures inside of Excel with only a few clicks.
From there we'll dive into Data Modeling 101, and cover the fundamentals of database design and normalization (including table relationships, cardinality, hierarchies and more). We'll take a tour through the Excel data model interface, introduce some best practices and pro tips, and then create our own relational database to analyze throughout the course.
Finally, we'll use Power Pivot and DAX to explore and analyze our Excel data model. Unlike traditional Excel Pivot Tables, Power Pivot allows you to analyze hundreds of millions of rows across multiple data tables (inside of Excel!), and create supercharged calculated fields using a formula language called Data Analysis Expressions (or "DAX" for short). We'll cover basic DAX syntax, then introduce some of the most powerful and commonly-used functions – CALCULATE, FILTER, SUMX and more.
If you're ready to take your MS Excel game to new heights and join the leading edge of analytics & business intelligence, this course is for you. It's time to stop fighting with tedious, manual tasks and struggling with "old-school" Excel; join me on this journey and emerge a certified excel analytics NINJA.
See you in there!
-Chris (Founder, Maven Analytics)
IMPORTANT: Power Query and Power Pivot are currently NOT available in Excel for Mac. You'll need a PC version of Excel that is compatible with Power Pivot (Excel 2010 with plug-in, Excel 2013, Excel 2016, or Excel 2019 Standalone, Office 365 Pro Plus, Enterprise E3/E5, Office Professional 2016, etc.)
__________
Looking for our full course library? Search "Maven Analytics" to browse our full collection of Excel, Power BI, SQL, Tableau, Python, Alteryx & Machine Learning courses!
Hear why this is one of the TOP-RATED Excel courses on Udemy, and the #1 Excel Power Query + Excel Power Pivot course:
"I am a self-taught Excel Power Query user and it took me a while to understand what each tool does and how it interacts with others. Thanks to your introduction I finally nailed it in a very clear, unambiguous way. You helped me build a method that I can confidently apply to my data in Excel. Thank you so much!"
-Francesca C.
"I'm less of an expert at breathing than Chris is at Excel. This course is thorough and well-planned, and he presents in a manner that simplifies the complicated. Well worth your time if you want to master Excel power query and power pivot!"
-Tim B.
"I'm geeking out, this is so cool. Where has this been all my life???"
-Karen P.
*This course includes Excel project files, quizzes & homework exercises, 1-on-1 instructor support, LIFETIME access and a 100% money-back guarantee!

 Udemy Discount
The discount is applied through our link. Open the course from here and Udemy's current promotional price is applied at checkout on most courses, no code to type.
Some courses are excluded from Udemy's promotions. If the price does not drop, clear your browser cookies and use the button again.
Instructor Details

- 4.7 Rating
 29,351 Reviews
Maven Analytics
Maven Analytics is an award-winning platform where individuals and teams build new skills, showcase work, and connect with experts around the world.
We've helped more than 2,000,000 learners around the world build job-ready data & AI skills, master tools like Excel, SQL, Power BI, Tableau and Python, and build the foundation for successful careers.
Start learning for free!
 Related courses
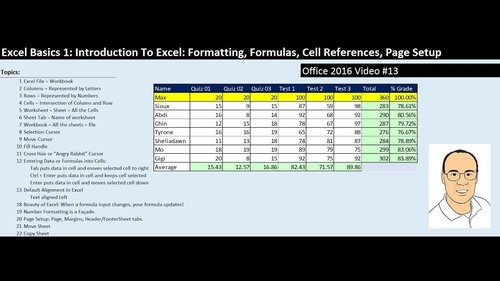
Microsoft Excel Data Analysis - Learn How The Experts Use It (2026)
5.0 (5,696 Reviews)
 Provider: Udemy
 Time: 3h
$39.99

More courses by Maven Analytics

Microsoft Power BI Desktop for Business Intelligence (2026)
4.6 (196,667 Reviews)
- Provider: Udemy
- Time: 17h
$139.99
Microsoft Excel: Advanced Excel Formulas & Functions (2026)
4.6 (120,271 Reviews)
- Provider: Udemy
- Time: 9.4h
$199.99
Microsoft Excel: Data Analysis with Excel Pivot Tables (2026)
4.7 (78,818 Reviews)
- Provider: Udemy
- Time: 6.8h
$199.99
Microsoft Excel: Data Visualization w/ Excel Charts & Graphs (2026)
4.6 (61,560 Reviews)
- Provider: Udemy
- Time: 4.6h
$199.99
Microsoft Power BI Desktop: Advanced DAX for Data Analysis (2026)
4.7 (15,632 Reviews)
- Provider: Udemy
- Time: 11.5h
$139.99
Microsoft Power BI: PL-300 Certification Prep (Data Analyst) (2026)
4.6 (13,023 Reviews)
- Provider: Udemy
- Time: 8.6h
$129.99
 Reviews

By Sivakumar Prithiviraj on 9/8/2026
Course focussed on the concepts and went into using the tools to execute those concepts. Language was simple and easy to follow and the entire course was engaging. Chris is a great communicator. Thanks a ton.
By KAUSTUBH MONI BORAH on 8/7/2026
Each and every topic was covered in details, which really gave insights to what PQ is capable of handling. The interesting part was how the diagram view allows us to properly filter through and not getting entangled mid way.
By Chase Willea on 7/28/2026
I would highly recommend taking Kyle Pew's Microsoft Excel Course Beginner to Advanced first if you're unfamiliar with Microsoft excel as I was. Mr. Dutton does a wonderful job with his explanations, and his pro tips are crucial to your success in this course. I will be taking more Udemy courses from him. I look forward to sharpening my skillset.
By David U. Morales on 7/27/2026
The information, presentation, and value is PHENOMENAL. What I don't like is that the volume on the video is VERY low. There was an intro video that had good volume and then the rest of the videos so far are very low.
By Debby Alighire on 7/15/2026
This is the second course I have taken with Maven. You exit the course with a fully built model which can be applied across businesses in any industry. Chris Dutton explains complex topics thoroughly and demonstrates foundational skills/habits throughout the course consistently.
By Andrew Villiers on 5/31/2026
As someone that has been using Excel for a number of years, I'd only dabbled with Power Query once or twice before. This course helped me to unlock a whole new area of Excel where I can now see the benefits of using Power Query, Power Pivot, and DAX to automate some of my analytics workflows.
By Saad on 5/15/2026
A fan of Chris's teaching methodology! Simple, clear, and to the point. I liked the content and breakdown leading to DAX and it's powerful usage. Beginning with Power Query, Power Pivot, and hands-on DAX made me more confident to handle complex data. Thank you, Maven team! Looking forward to learning more from Maven Analytics
By Ty Torrance on 5/13/2026
This course is very detailed. The manner in which summary detail is provided initially and then the topics are expanded upon using examples from the resource files provided is very helpful.
By Cathy Steiff on 5/8/2026
I learned some new helpful tips and tricks. I would have preferred a walkthrough of the assignments to insure I did them correctly. Just having the answers does not help if you have an error or mistake.
By Filip Praet on 4/14/2026
Hyphen: Solid course that clearly explains the fundamentals of Power Query, DAX, the data model, and Power Pivot. The content is well-structured and easy to follow, with practical examples and useful exercises. It has been particularly helpful in improving and automating recurring reporting tasks.
By Santanu Das on 11/8/2020
This course was thorough, pace was perfect, structured professionally and slide quality was awesome. it helped me a lot to build a solid and structured knowledge base on this very subject. Its a great experience learning from Chris. He pulled every thing which happens behind the scene to understand the execution better than. He is a masterpiece no doubt
By K S Sanjay Chandra Sikakollu on 11/8/2020
Another amazing course! This is my 3rd course from Maven Analytics. Chris is an amazing instructor
 Quality Score
Overall Score : 94 / 100
- Video Duration:
 7.3h
- Price: $17.99
- Provider: Udemy
- Updated:
 June 2026
- Level:
 All Levels
- Language:
 English
- Certificate:
 Yes
- Lectures:88 in 7 sections
- Practice:5 quizzes
- Students:138,100
- Subtitles:14 languages
- Udemy badge:Bestseller
30-day money-back guarantee on most paid courses
Udemy Coupon Price Tracker
